A PostgreSQL query has been stuck for four minutes. Your dashboard highlights the session that is waiting, its runtime climbing in red. The tempting move is obvious: copy the PID, call pg_terminate_backend, and move on. I have watched skilled engineers do exactly this under pressure — and kill the wrong session, because the query the dashboard shows you waiting is almost never the transaction actually holding the lock. That gap is the whole problem in PostgreSQL lock diagnosis: the loudest session is the wrong one to touch.
This is the first of a two-part series on building a guarded PostgreSQL lock diagnosis agent. Part 1 is about evidence: how to find the real root blocker, how to package every incident into one machine-checkable report, and how to keep the whole thing read-only so it physically cannot amplify an outage. Part 2 adds the authority ladder — when a system may cancel or terminate, and whether orchestrating this with an agent measurably beats a plain script. Everything here is backed by a public, runnable lab you can clone: postgres-lock-agent-lab. I am sharing what I have learned building this evidence layer with teams who run PostgreSQL in production.
One boundary holds from the first line to the last: diagnosis never grants the authority to act. A perfect report is still just a report.
1. Find the root blocker, not the waiting query
Picture three sessions. Session A opened a transaction and updated row 1 but never committed. Session B updated row 2, then tried to update row 1 — and is now waiting behind A. Session C tried to update row 2 and is waiting behind B. Your dashboard, sorted by wait time, screams about C. C is the visible waiter. It is the most downstream, most innocent participant in the chain.
The naive fix — target the oldest or longest-waiting query — is wrong for a structural reason. Blocking in PostgreSQL is a graph, not a list, and the node you can see is a leaf. To find the root you have to traverse the edges, and the edges are not what a simple lock listing shows you.
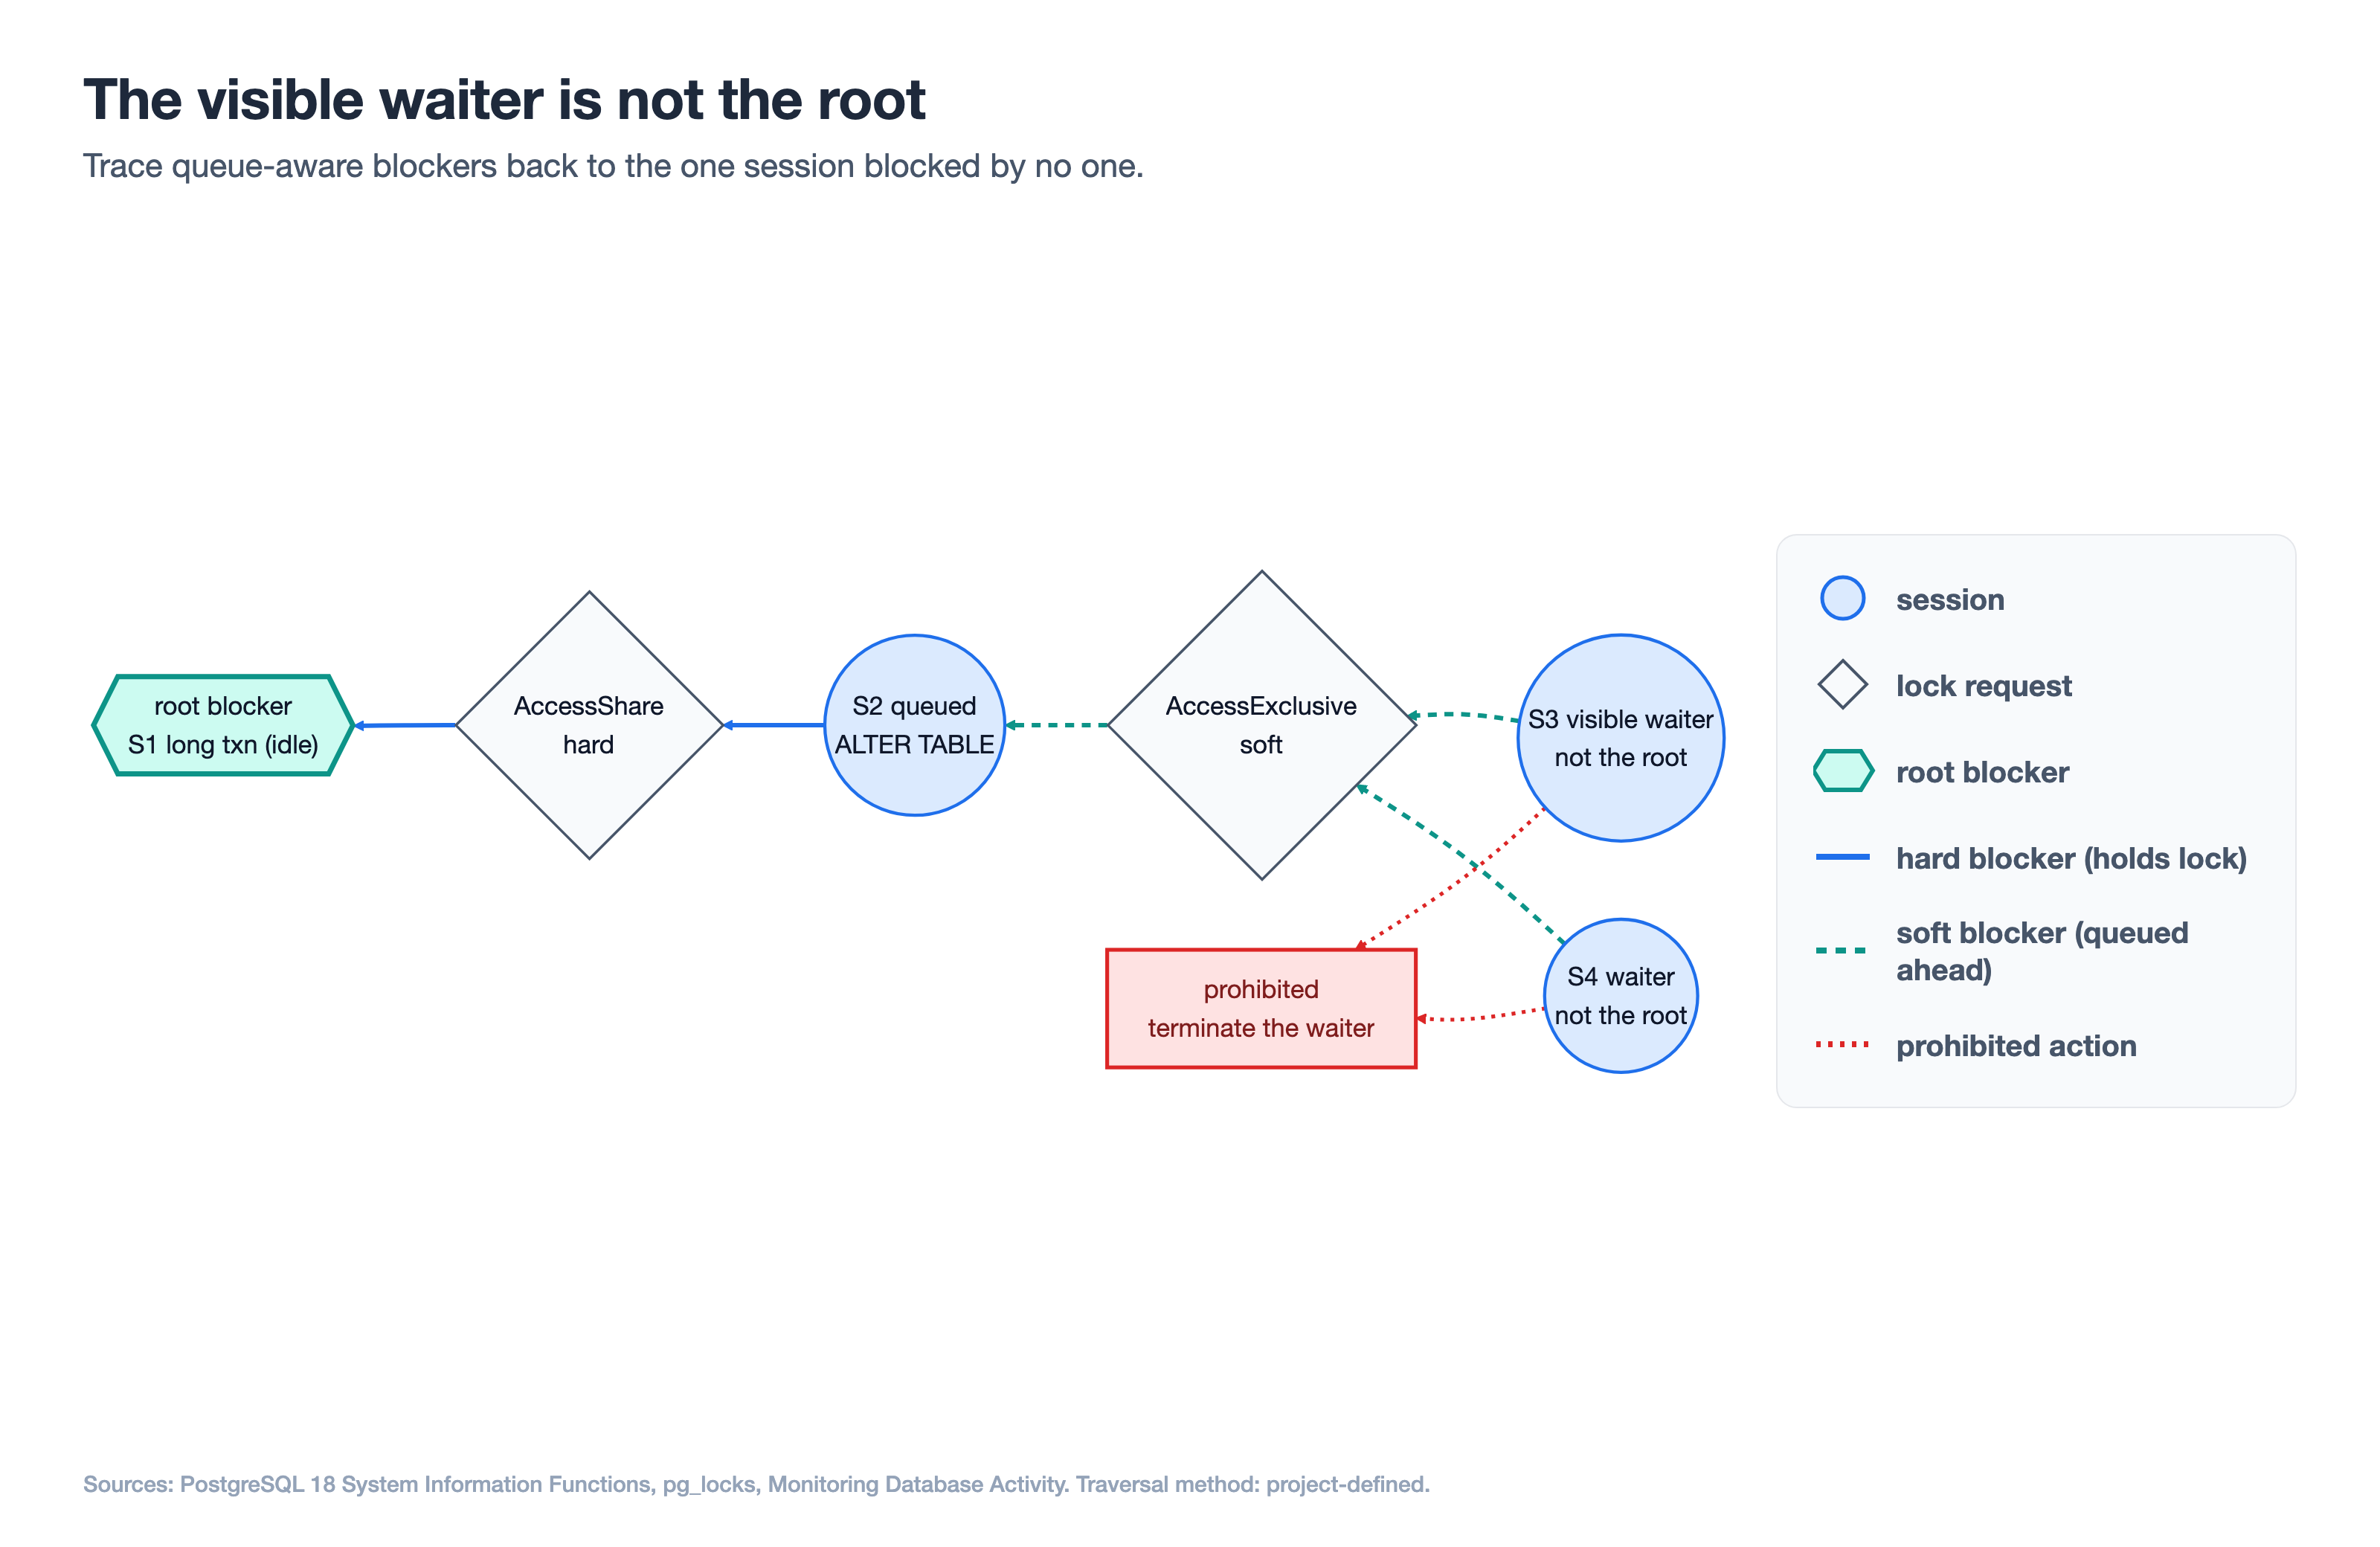
The visible waiter is a leaf. Trace the queue-aware edges back to the one session no edge leaves — the root blocker — and never target the waiter.
Hard blockers, soft blockers, and the wait queue
PostgreSQL exposes the right traversal function directly. Per the System Information Functions documentation, pg_blocking_pids(pid) returns the process IDs blocking a target process from acquiring a lock. Crucially, it returns two kinds of blocker:
- Hard blockers already hold a conflicting lock on the object the target wants.
- Soft blockers do not hold a conflicting lock yet, but their conflicting request sits ahead of the target in the wait queue.
That second category is why you cannot reconstruct the truth from granted locks alone. A session can be blocked by another session that has not acquired anything yet — it is simply earlier in line. This is also how a single queued schema change can stall an entire table: I will come back to it below.
The pg_locks view tempts you to build this yourself with a self-join — match waiters to holders on the same lockable object. The PostgreSQL documentation explicitly steers you away from that and recommends pg_blocking_pids() instead, precisely because blocker identity depends on both held locks and wait-queue order. A self-join over granted rows silently drops every soft blocker.
The queue-aware rule behind pg_blocking_pids()
Here is the rule the agent enforces, and it is short: the root blocker is the session that blocks others but is itself blocked by no one. In graph terms, walk the pg_blocking_pids() edges and find the node with no incoming block edge. In the lab, that walk is a handful of lines in adapters.py:
edges = {
    int(row["pid"]): tuple(int(pid) for pid in row.get("blocking_pids") or ())
    for row in activity
    if row.get("blocking_pids")
}
all_waiters = set(edges)
all_blockers = {pid for blockers in edges.values() for pid in blockers}
roots = sorted(all_blockers - all_waiters)
if len(roots) != 1:
    raise InsufficientEvidenceError("blocking chain must resolve to exactly one root")
all_blockers - all_waiters is the whole idea: a session that appears as someone's blocker but never as a waiter. If the snapshot is ambiguous and produces zero or several such roots, the adapter refuses to guess and raises InsufficientEvidenceError. Refusing to classify is a first-class outcome, not a failure.
One more thing the visible waiter cannot tell you: whether the session it is waiting on is active or idle. A backend can be active in pg_stat_activity and still be waiting somewhere in the system — session state and wait state are independent fields. The root of your chain is frequently a session that is idle in transaction, holding a lock it acquired minutes ago and forgot about. Age of the waiting query tells you nothing about that.
2. Standardize one incident report, not one evidence path
Five failure modes leave five very different kinds of evidence. A live blocking chain gives you a full graph right now. A deadlock is already gone by the time you look — PostgreSQL resolved it and moved on. It is tempting to build five different tools. That is the wrong axis to standardize on.
The insight the lab is built around: standardize the output, not the evidence path. Every incident, regardless of mode, must normalize into the same envelope. That is what makes the result machine-checkable, testable, and comparable across modes. The evidence paths stay mode-specific; the report is universal.
The eight-field incident report contract
The shared report — defined once in report.py as a frozen, extra="forbid" Pydantic model — has exactly eight fields:
| # | Field | What it holds |
|---|---|---|
| 1 | observation_timestamp | When the evidence was collected (timezone-aware) |
| 2 | classification | The incident mode: blocking chain, resolved deadlock, lock timeout, DDL queue, or hot-row contention |
| 3 | root_source | The root blocker session or the contention source |
| 4 | supporting_observations | The normalized evidence that backs the classification |
| 5 | confidence | High, medium, or low |
| 6 | recommendation | A preventive change, cancel, terminate, or no action |
| 7 | authority_requirement | Observe-only, approval-gated, or pre-authorized bounded action |
| 8 | audit_record | Inputs, policy result, and a report_id for traceability |
A test pins the shape so it cannot drift — test_report_exposes_exactly_eight_fields in tests/test_report.py asserts the dumped model has exactly those eight keys and nothing else. Note field 7: every report carries an authority_requirement, and every adapter in Part 1 sets it to observe_or_recommend_only. The field exists so authority is explicit and visible even in the read-only build — but nothing in Part 1 can escalate it. Part 2 is where that field starts to matter.
To be clear about provenance: the eight fields are grounded in real PostgreSQL evidence (timestamps, waits, lock modes, captured errors), but the envelope itself — the specific eight-field contract — is this guide's synthesis for making incidents comparable. It is not PostgreSQL-native terminology.
Five evidence states for lock diagnosis
The same is true of the second concept the report leans on: evidence states. PostgreSQL does not label evidence as "fresh" or "gone." This lab does, with a five-value taxonomy defined in report.py:
live— collected from current catalog views while the condition is still active.historical— a retained artifact of an event PostgreSQL has already resolved (a captured error, a log line).inferred— a pattern assembled from repeated samples, not a single observation.stale— evidence old enough that identities like PIDs may no longer mean what they meant.insufficient— not enough to support any classification.
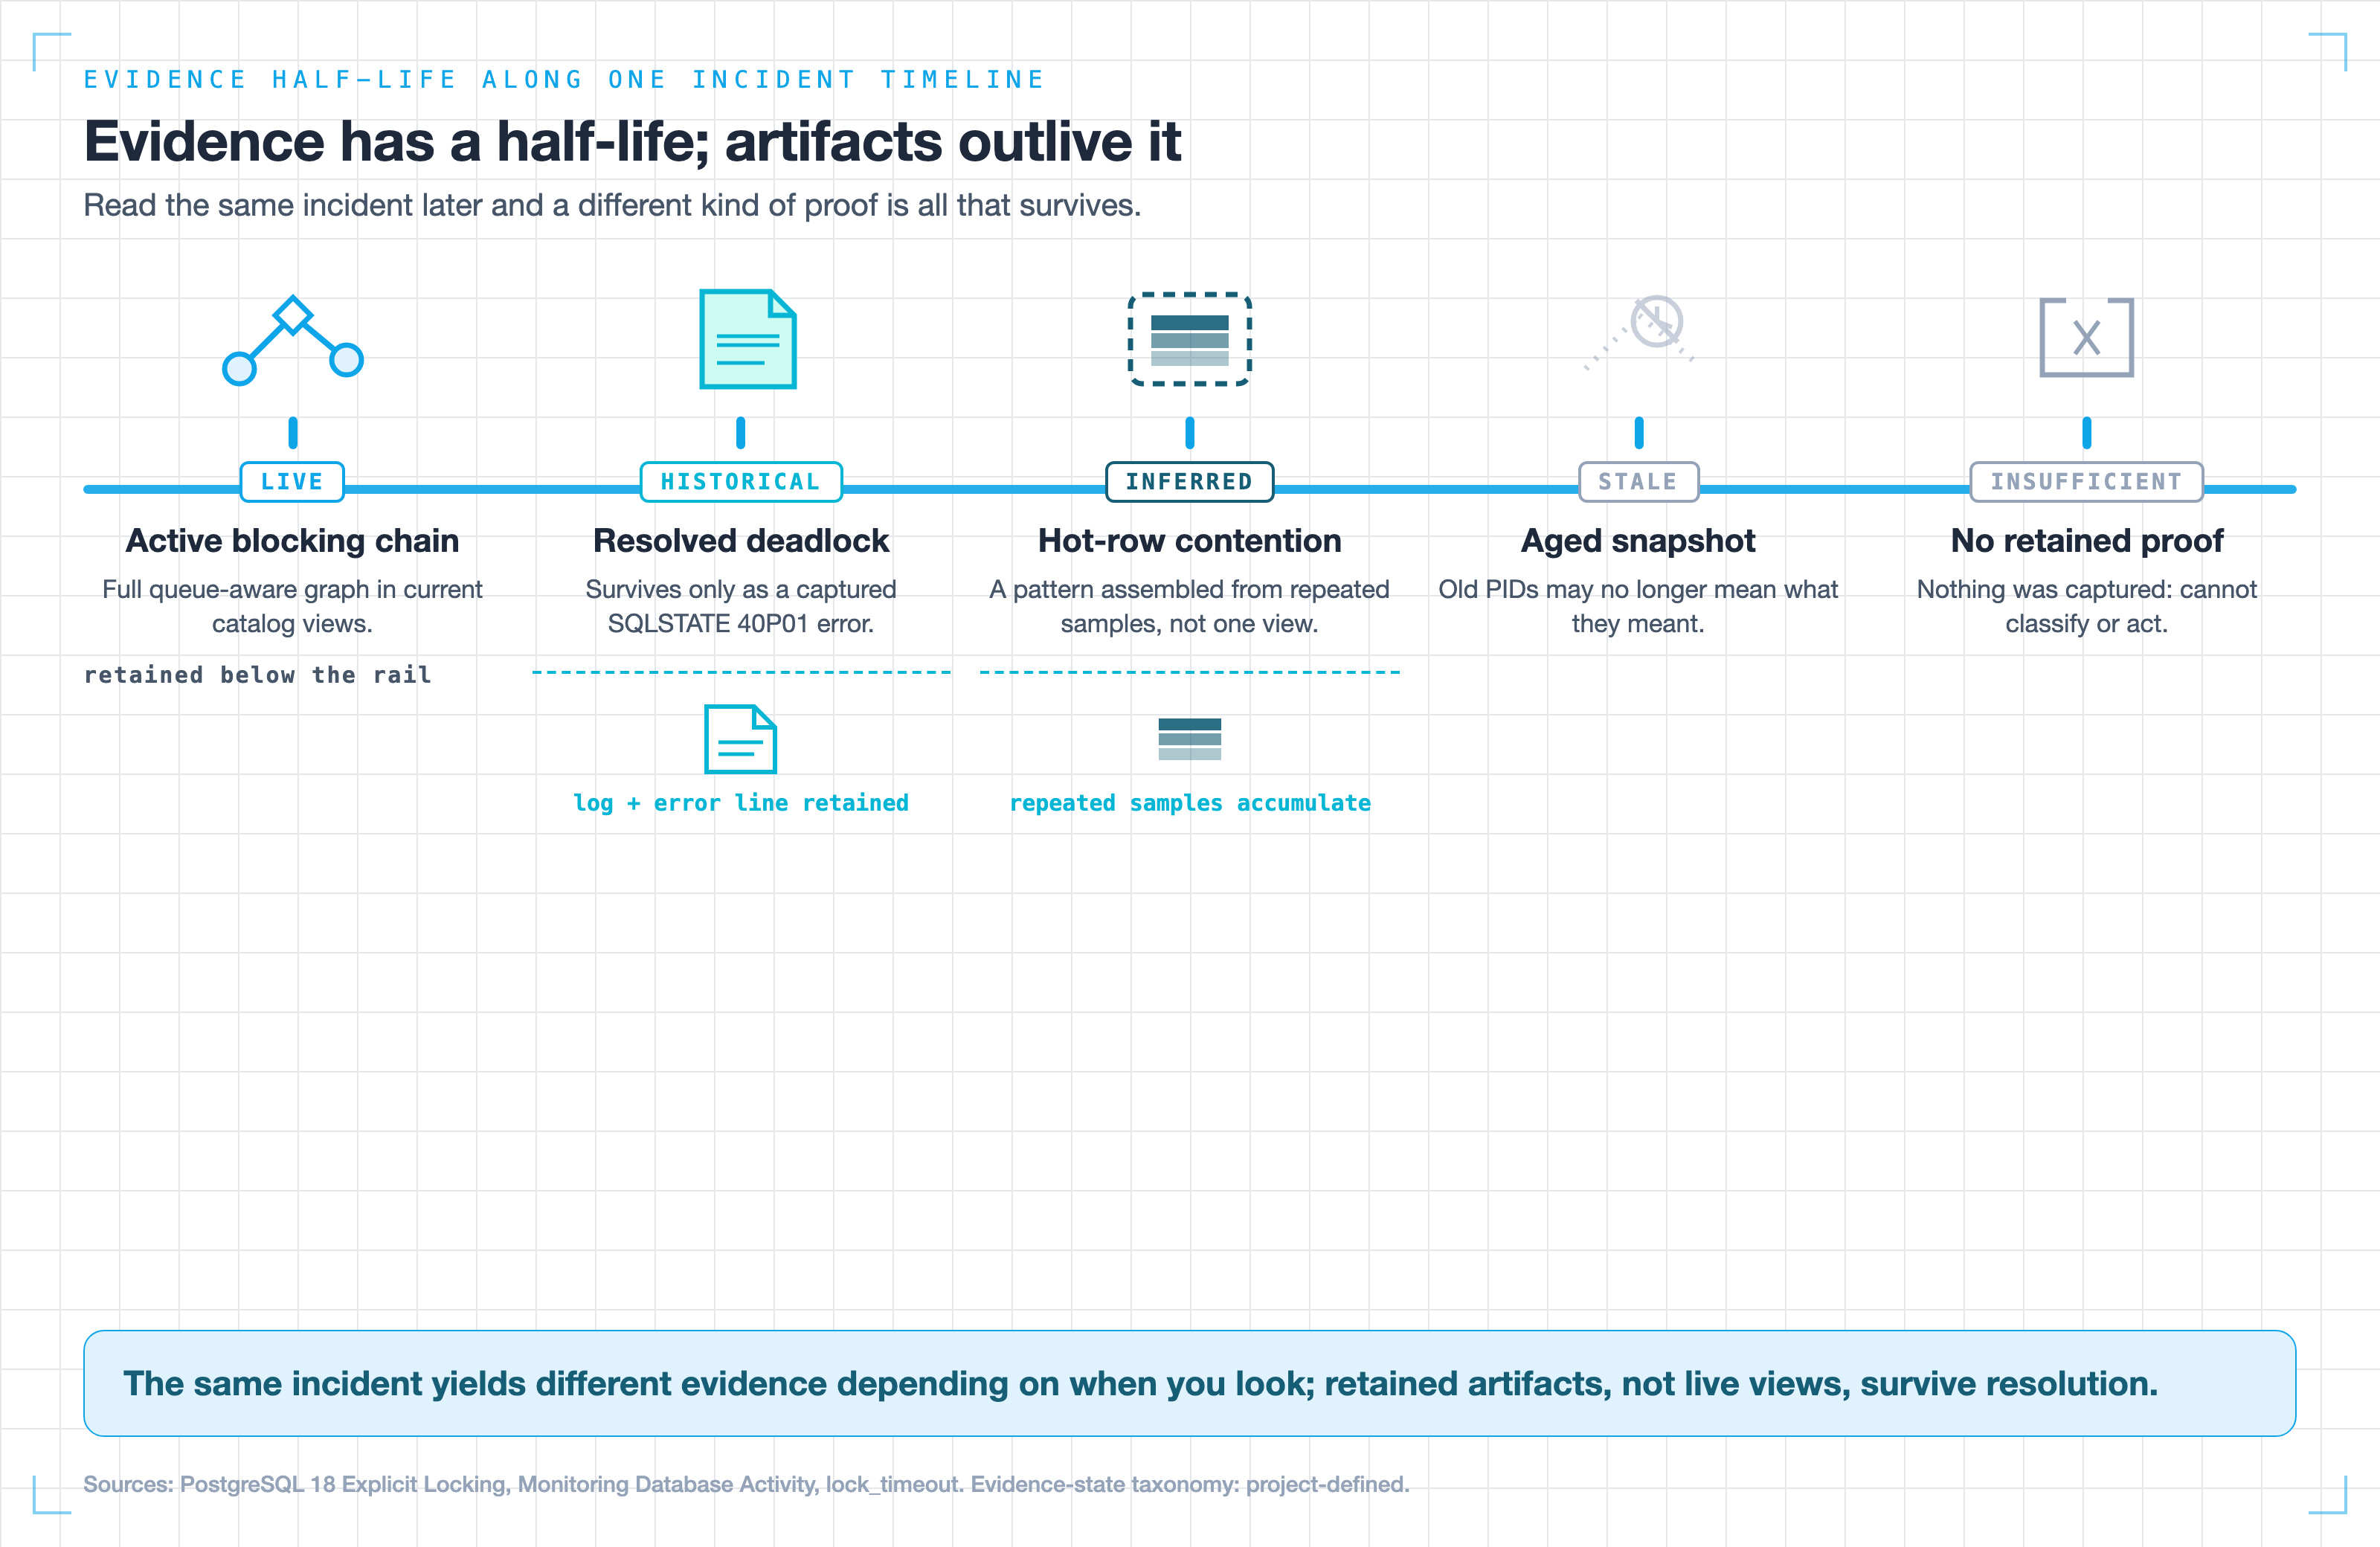
The same incident yields different provable facts depending on when you look: a resolved deadlock survives only as a captured error, and hot-row contention only emerges from repeated samples. The five-state taxonomy is this guide's own synthesis, not PostgreSQL-native terminology.
These states are a design taxonomy, not a PostgreSQL feature. I am calling that out explicitly because the whole point of naming them is to make confidence testable. The report's validator enforces the link between the two: high confidence cannot rest on stale or insufficient evidence.
if self.confidence is Confidence.HIGH and any(
    item.state in {EvidenceState.STALE, EvidenceState.INSUFFICIENT}
    for item in self.supporting_observations
):
    raise ValueError("high confidence cannot rely on stale or insufficient evidence")
The validator also refuses evidence timestamped after the report itself (supporting evidence cannot postdate the report) and requires an audit identifier. test_high_confidence_rejects_stale_evidence and test_report_rejects_evidence_newer_than_report lock both rules in. This is how the report handles evidence that shifts underneath it: it timestamps collection, tags each observation with a state, and structurally forbids a confident conclusion built on evidence that has decayed. When facts change between collection and use, the honest move is to lower confidence or refuse — not to assert. Part 2 extends this same freshness logic into the action path, where a stale PID is not just a weak conclusion but a dangerous one.
The observed-fact / inferred boundary
One discipline runs through every adapter: separate what PostgreSQL proves from what the classifier infers. pg_blocking_pids() returning [101] for session 102 is an observed fact. Concluding "this is hot-row contention" from three repeated samples is an inference. The report keeps them apart — observed facts live in supporting_observations with a live or historical state; inferences show up as inferred and force a lower confidence band. Blurring that line is how a diagnosis tool starts hallucinating root causes.
3. Build the read-only diagnostic collector
Before any reasoning, you need a deterministic evidence layer. The collector in collector.py does exactly four things, and it does them through fixed, allowlisted SQL — no model-generated queries, ever.
- Read current activity from
pg_stat_activity, includingstate,xact_start,query_start,wait_event_type,wait_event, andpg_blocking_pids(a.pid)inline. - Build queue-aware edges via that
pg_blocking_pids()call. - Explain each edge with
pg_locksfields —locktype,mode,granted,waitstart, and the relation. - Read relevant configuration from
pg_settings:deadlock_timeout,lock_timeout,statement_timeout,idle_in_transaction_session_timeout, andlog_lock_waits.
The activity query is deliberately narrow:
SELECT
    a.pid, a.usename, a.application_name, a.state,
    a.xact_start, a.query_start, a.wait_event_type, a.wait_event,
    pg_blocking_pids(a.pid) AS blocking_pids
FROM pg_catalog.pg_stat_activity AS a
WHERE a.datname = current_database()
  AND a.pid <> pg_backend_pid()
  AND a.backend_type = 'client backend'
ORDER BY a.pid;
The three queries are frozen as constants in ALLOWED_SQL, the connection is forced read_only = True, and _fetch_dicts raises if a query is not on the allowlist. The safety test test_collector_enforces_read_only_and_allowlisted_queries in tests/test_collector.py asserts the connection was set read-only, was closed, and executed exactly the allowlisted SQL in order. The collector emits typed, normalized EvidenceObservation objects — each with a source, summary, state, and timezone-aware observed_at — not raw tuples.
Why pg_stat_activity is evidence, not truth
Monitoring views are observational, not a serializable snapshot. A collector that ignores this will lie confidently. The lab treats each of these as a first-class caveat to measure and test, not a footnote:
- Snapshot drift. Fast-moving waits can appear and vanish between the activity read and the lock read. The report timestamps collection and tolerates missing edges rather than claiming a perfect reconstruction.
- Statistics caching. Current-query fields update continuously, but cumulative counters can lag, and values read inside a transaction stay cached until it ends. The collector reads outside a long-lived transaction and treats a counter like
pg_stat_database.deadlocksas proof that deadlocks occurred, not as incident timing. - PID 0 from prepared transactions. A prepared (two-phase) transaction can appear with process ID
0. It holds locks but has no live backend to signal, so it can never be a normal "root session" you act on. - Duplicate PIDs from parallel queries. Parallel workers can surface duplicate client-visible PIDs. Edge counting has to be robust to a PID appearing more than once.
- Privilege limits. Full visibility into other sessions depends on privileges such as membership in
pg_read_all_stats. Under-privileged, the collector sees a partial world — which must lower confidence, not silently truncate the graph. - Null
waitstart.pg_locks.waitstartrecords when a wait began, but it can briefly be null right after the wait starts. Any "how long has this waited" logic has to survive a null. - Polling overhead.
pg_blocking_pids()briefly touches shared lock-manager state, and frequentpg_locksreads add load. Collection is not free.
That last point is a measurement, not a slogan. The honest way to state collection cost is: reproducible by you. The lab's plan is to compare workload latency and throughput with diagnostics disabled versus enabled using pgbench, and publish the raw logs — not to quote a number I have not measured. I have no overhead figure to give you yet, and I would rather say that plainly than invent one.
4. Five lock failure modes, one shared report
Each failure mode gets its own adapter. Every adapter reads the immutable evidence bundle, does mode-specific reasoning, and returns the same eight-field report — or raises InsufficientEvidenceError. In the lab, a single LangGraph node routes the evidence to the right adapter and returns the report; the graph has no cancel, terminate, DDL, or arbitrary-SQL node at all. I describe LangGraph here only through what the code and tests actually do — test_graph_exposes_no_mutation_node asserts the compiled graph's nodes are exactly {__start__, diagnose, __end__} — not through any framework marketing.
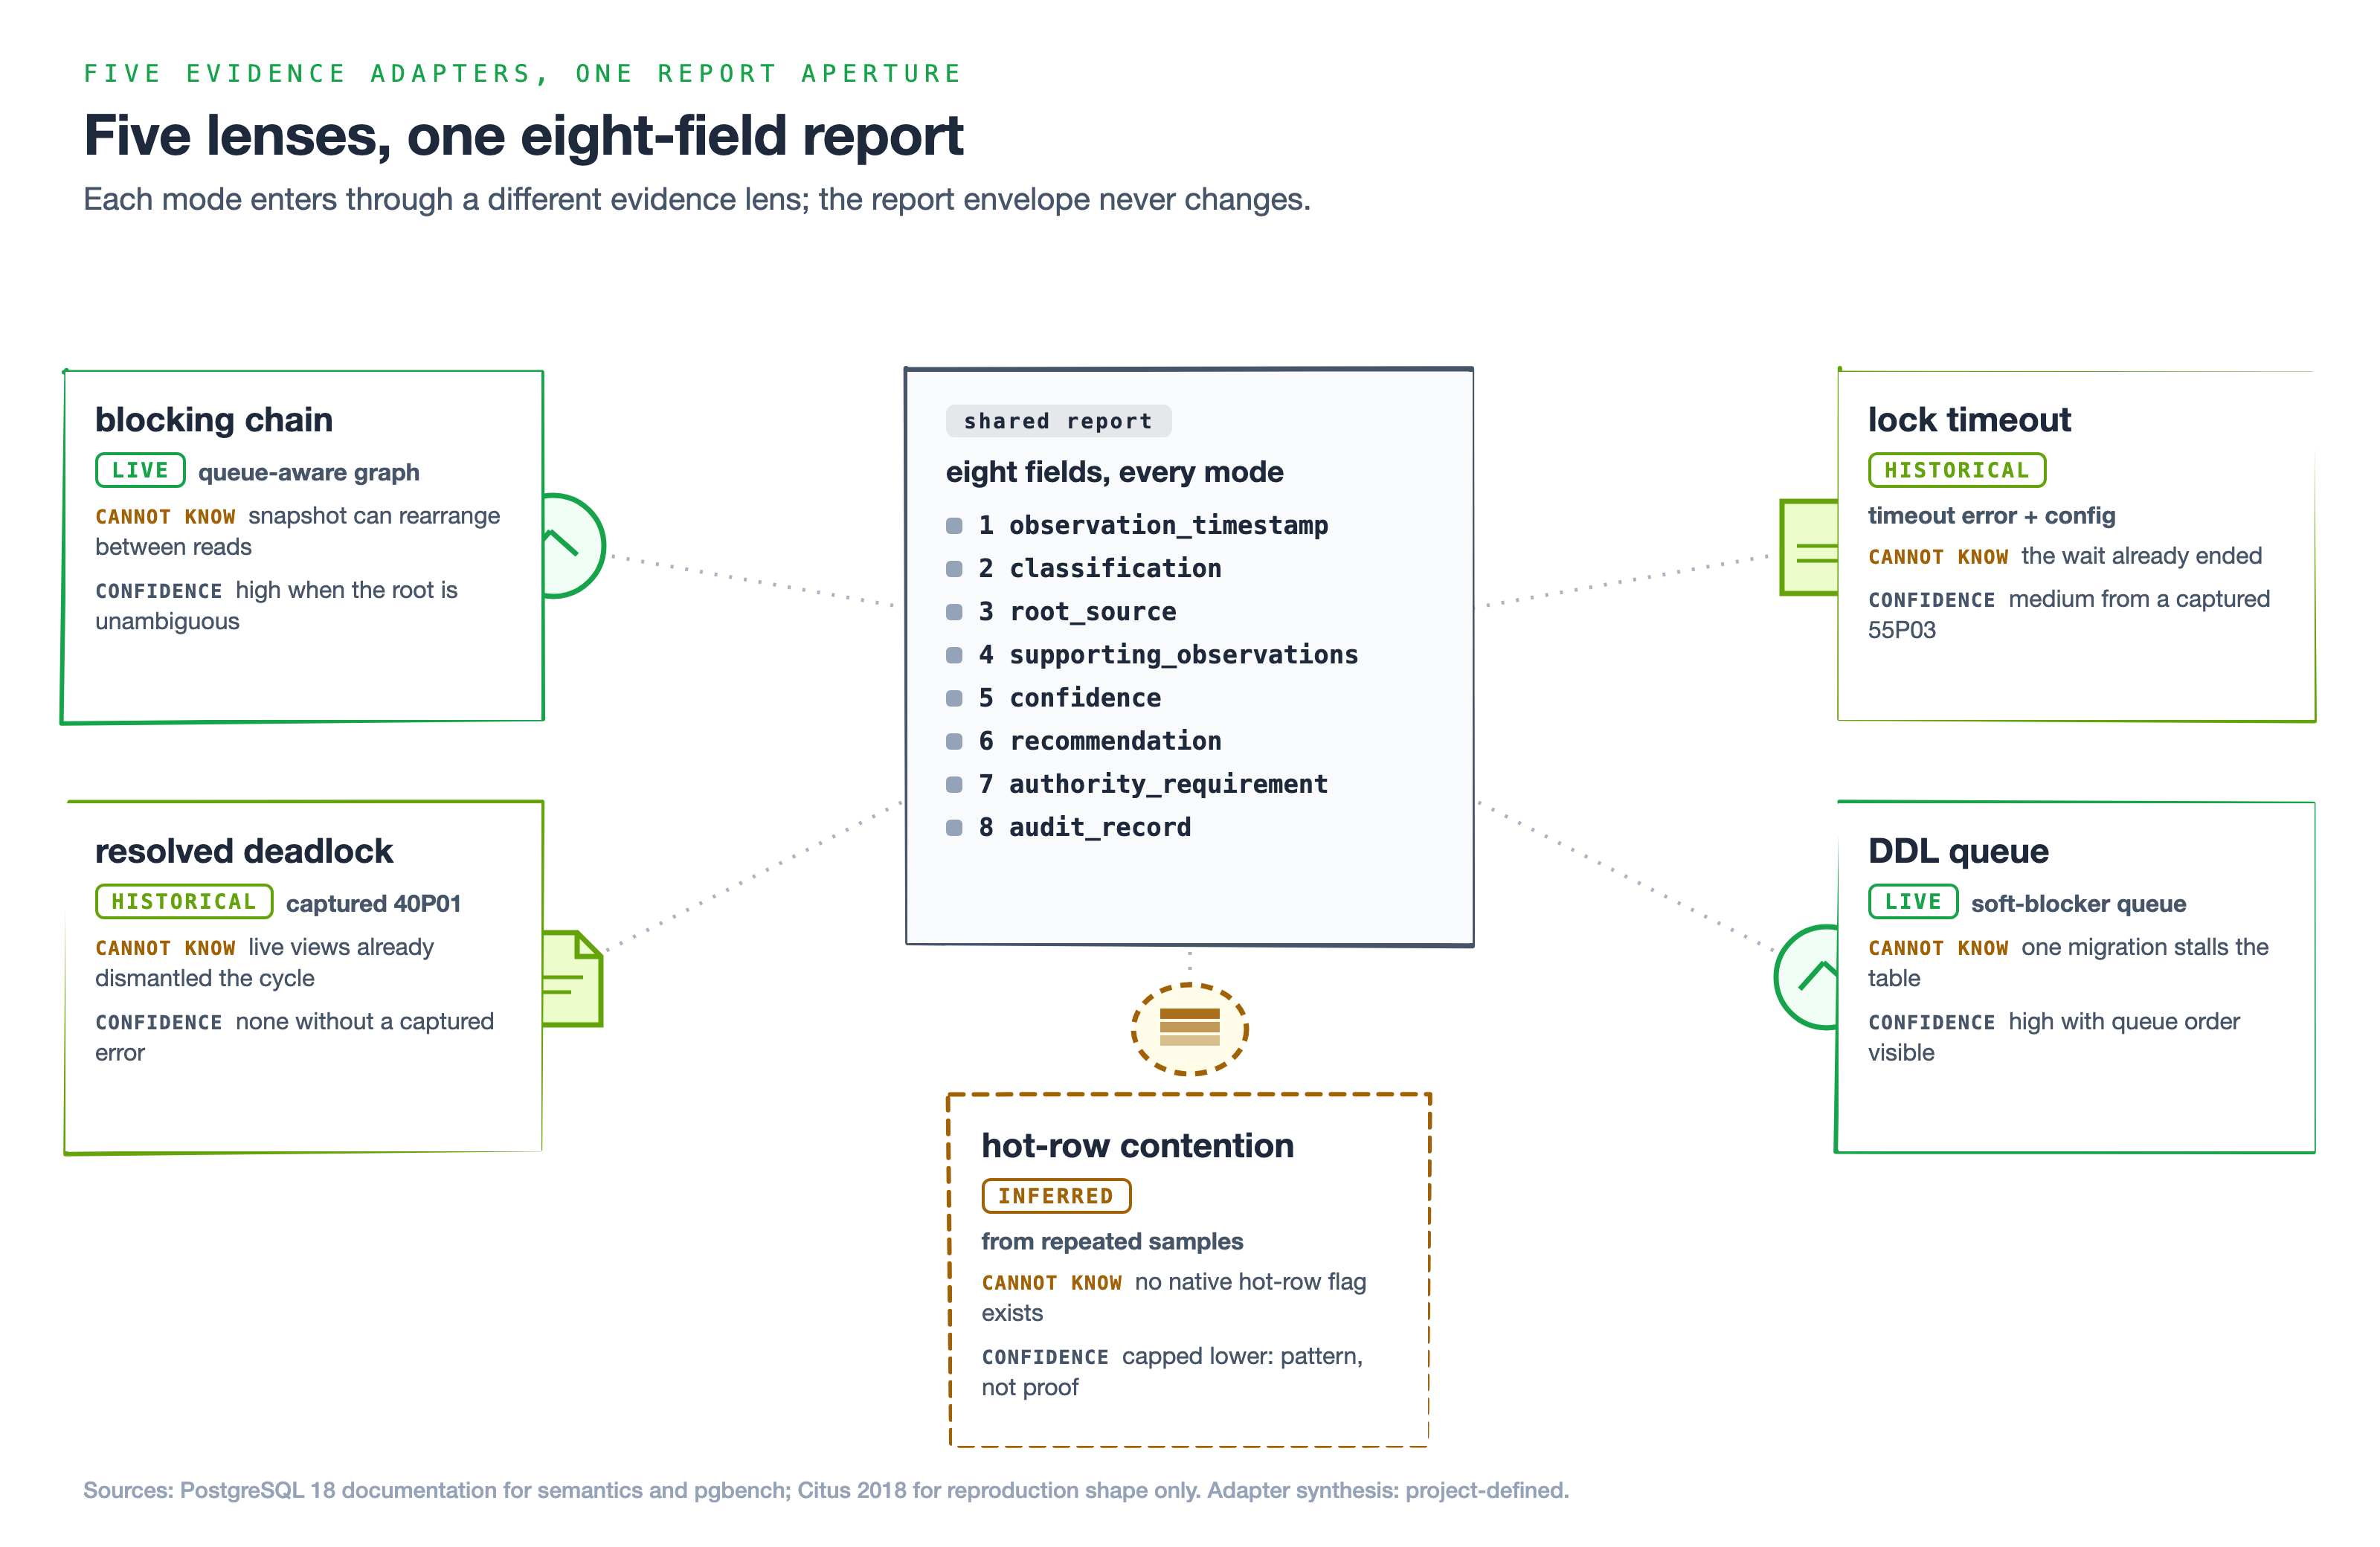
Five modes enter through different evidence states with visibly different confidence, but every one exits as the same eight-field report. The eight-field report and the adapter split are this guide's own synthesis.
Live blocking chain — the strongest live evidence
This is the minimum viable lab and the one mode with genuinely strong live evidence. The discriminating source is the queue-aware pg_blocking_pids() graph, resolved to a single root as shown in Section 1. Confidence is high because the evidence is current and the root is unambiguous. What it cannot know: anything the snapshot missed. If the chain rearranged itself between two catalog reads, the graph is a slightly stale photograph.
Resolved deadlock — historical evidence or nothing
PostgreSQL detects a deadlock automatically and, per the Explicit Locking documentation, aborts one transaction to break the cycle. That is the trap: by the time you query live views, the deadlock is gone. The active graph has been dismantled. pg_stat_database.deadlocks gives you a cumulative count at database scope, which confirms deadlocks have happened but reconstructs no single incident.
So the deadlock adapter refuses to work from live views. It requires retained, historical evidence — specifically a captured SQLSTATE 40P01:
matching = [
    item for item in evidence
    if item.state is EvidenceState.HISTORICAL
    and item.details.get("sqlstate") == "40P01"
]
if not matching:
    raise InsufficientEvidenceError("resolved deadlock requires captured SQLSTATE 40P01")
test_live_views_cannot_reconstruct_resolved_deadlock proves it: feed the adapter live-only evidence and it raises, matching on 40P01. What it cannot know: the full historical lock graph, unless you retained server logs or captured the error at incident time. The selected PostgreSQL sources give you the count and the victim behavior, not a replay.
Completed lock timeout — a different SQLSTATE, a different cause
A lock timeout is not a deadlock, and conflating them is a common diagnosis error. Per the lock_timeout documentation, lock_timeout aborts a statement after it spends the configured duration waiting to acquire a lock — and it applies separately to each lock-acquisition attempt. It is distinct from statement_timeout (which caps total statement time) and from deadlock_timeout (which, per Lock Management, just controls how long PostgreSQL waits before running a deadlock check). A lock_timeout at or above statement_timeout never fires, because statement_timeout gets there first.
The adapter keys on SQLSTATE 55P03 plus the timeout context, and lands at medium confidence — because a completed timeout, like a deadlock, is a historical artifact you had to capture before the waiter disappeared:
matching = [
    item for item in evidence
    if item.state is EvidenceState.HISTORICAL
    and item.details.get("sqlstate") == "55P03"
    and item.details.get("lock_timeout_ms")
]
So the answer to "how are deadlocks different from lock timeouts?" is threefold: different detection (automatic cycle-check vs. per-acquisition timer), different SQLSTATE (40P01 vs. 55P03), and — once resolved — both need retained evidence, not live views. What it cannot know: whether the same statement would time out again, without re-running it.
DDL or migration queue — one session stalls the table
This is where soft blockers earn their keep. Many forms of ALTER TABLE acquire an ACCESS EXCLUSIVE lock, which conflicts with every other table-level mode — including the ACCESS SHARE that a plain SELECT takes. Now recall wait-queue ordering: a queued ACCESS EXCLUSIVE request that has not been granted yet still sits ahead of later SELECTs in line. Those readers queue behind the DDL before it even acquires its lock. One migration, waiting on one long transaction, can freeze reads across a whole table. The 2018 Citus write-up PostgreSQL Rocks, Except When It Blocks shows the two-session reproduction shape nicely — I use it only for the shape; every semantic claim here comes from the PostgreSQL 18 docs.
The adapter finds the one waiting DDL session (by command tag) and resolves its queue-aware blocker:
ddl_waiters = [
    row for row in activity
    if row.get("command_tag") in {"ALTER TABLE", "CREATE INDEX", "DROP TABLE"}
    and row.get("blocking_pids")
]
if len(ddl_waiters) != 1:
    raise InsufficientEvidenceError("DDL queue requires one labeled waiting DDL session")
What it cannot know: the exact lock mode from the command tag alone. ALTER TABLE covers many subcommands with different lock strengths, and this varies by subcommand and PostgreSQL version. The adapter identifies the queue; it does not assert a universal ALTER TABLE lock mode.
Hot-row contention — inferred, never labeled
There is no catalog flag that says "hot-row contention." It is a pattern, and the only honest way to diagnose it is from repeated evidence. Row-level locks mostly do not appear directly in pg_locks — a same-row waiter typically shows up as waiting on the holder's transaction ID. So the adapter demands at least three samples that recur on the same contention key:
samples = [item for item in evidence if item.source == "repeated_lock_samples"]
keys = [str(item.details.get("contention_key", "")) for item in samples]
counts = Counter(key for key in keys if key)
if len(samples) < 3 or not counts:
    raise InsufficientEvidenceError("hot-row inference requires at least three samples")
key, count = counts.most_common(1)[0]
if count < 3:
    raise InsufficientEvidenceError("no contention source recurs across three samples")
Confidence is medium and the evidence state is inferred, by construction. test_one_sample_cannot_prove_hot_row_contention proves a single sample raises. A skewed workload — pgbench with random_zipfian — can reproduce the pattern for a test, but the "three samples" bar and any wait threshold are lab policy choices I picked and tested, not PostgreSQL facts. What it cannot know: whether contention is harmful, from a threshold alone. There is no universal number for a "bad" wait.
The through-line across all five: the report envelope is identical, but the evidence path, the confidence band, and — critically — what each mode cannot prove are all different. That is the payoff of standardizing the output instead of the evidence.
5. Build it yourself: three PostgreSQL lock agent projects
Three projects, beginner to advanced, all inside Part 1's scope: read-only evidence, the report contract, the adapters, and the collection caveats. Nothing here touches action authority — that is Part 2. Everything points at specific files and tests in postgres-lock-agent-lab.
Project 1 (Beginner): Reproduce one live blocking chain and prove the guard
- Goal: Reproduce a real two-hop blocking chain against a disposable PostgreSQL 18 database, emit the eight-field report from read-only evidence, and prove the workflow cannot reach a mutation tool.
- Prerequisites: Docker,
uv, and the cloned repo. No production access — none is allowed. - Steps:
docker compose up -d --waitto start the disposable PostgreSQL 18 service fromcompose.yaml(data intmpfs, port55432).- Run the deterministic suite:
uv run --group dev pytest. Confirm the report and workflow tests pass and the live test is skipped. - Run the live chain: set
LOCK_AGENT_TEST_DSNand runtests/test_live_postgres.py. It builds a three-session row-lock queue, collects catalog evidence, and asserts the graph names the first transaction asroot_source. - Read
test_graph_exposes_no_mutation_nodeintests/test_workflow.py. It asserts the compiled graph's nodes are exactly{__start__, diagnose, __end__}.
- Success signal (machine-checkable):
pytestis green with the live chain resolvingroot_sourceto the root session's PID, and the moment you wire any mutation node (say, apg_cancel_backendstep) into the graph,test_graph_exposes_no_mutation_nodegoes red. The test must fail if a mutation tool becomes reachable. - Time: 45–60 minutes.
- Stretch goal: Extend the fixture to a four-session chain and confirm the root still resolves to exactly one PID.
This is the canonical call to action: clone postgres-lock-agent-lab, add a mutation tool to the graph, and watch the mutation-reachability test fail. If it does not fail, your guard is not real.
Project 2 (Intermediate): Add the five adapters and confidence-lowering states
- Goal: Drive all five adapters from fixtures and prove each one refuses to classify without its discriminating evidence, while
staleandinsufficientstates correctly cap confidence. - Prerequisites: Project 1 complete.
- Steps:
- Study the five entries in
tests/fixtures.py— thelive,historical, andinferredevidence each mode needs. - Run the parametrized
test_every_mode_emits_the_shared_reportand confirm all five produce an eight-field report with the expectedroot_source. - Feed the deadlock adapter live-only evidence and the hot-row adapter a single sample; confirm both raise
InsufficientEvidenceError. - Build a report with a
staleobservation athighconfidence and confirm thereport.pyvalidator rejects it.
- Study the five entries in
- Success signal (machine-checkable): All five adapters pass with correct
root_sourcevalues; the deadlock and hot-row negative tests raiseInsufficientEvidenceError; andtest_high_confidence_rejects_stale_evidencepasses. Add a new adapter toIncidentModewithout registering it and confirmtest_graph_exposes_no_mutation_node'sset(ADAPTERS) == set(IncidentMode)assertion fails. - Time: 1.5–2 hours.
- Stretch goal: Add a sixth mode fixture whose evidence is deliberately ambiguous and assert the adapter refuses rather than guesses.
Project 3 (Advanced): Harden the collector against the caveats and measure its cost
- Goal: Make the read-only collector robust to the real-world caveats — snapshot drift, PID 0, duplicate parallel PIDs, null
waitstart, and privilege limits — and set up a reproducible overhead measurement. - Prerequisites: Projects 1–2 complete; comfort with
pgbench. - Steps:
- Extend
tests/test_collector.pywith fake rows for a PID-0 prepared transaction, a duplicated parallel-worker PID, and a nullwaitstart; assert the edge logic and freshness logic survive each. - Run the collector against the live service under a restricted role and confirm reduced visibility lowers confidence instead of silently dropping edges.
- Drive load with
pgbenchusingrandom_zipfian, run several-minute trials with--random-seedfixed, and capture per-transaction logs with-l. - Measure workload latency and throughput with the collector disabled versus enabled, and retain the raw
pgbenchlogs alongside the run configuration.
- Extend
- Success signal (machine-checkable): The new collector caveat tests pass; the restricted-role run yields a report at reduced confidence rather than a truncated graph; and you have two committed
pgbenchlog sets (diagnostics off vs. on) with identical seed, scale, concurrency, and duration, so the overhead delta is reproducible by anyone who clones the repo. Report the delta you measured — do not borrow a number from anywhere, including me. - Time: 3–4 hours.
- Stretch goal: Script the whole overhead comparison so a single command regenerates both log sets and the diff.
What Part 2 covers
Part 1 stops exactly where authority begins. You now have a read-only agent that finds the true root blocker, normalizes five failure modes into one testable report, expresses honest confidence, and cannot reach a mutation tool. That is the quick win, and it stands on its own.
Part 2 answers the questions this design deliberately left open: why a well-supported report still does not grant permission to act; how to keep a system from firing unrestricted or stale database actions; when to pg_cancel_backend a query versus pg_terminate_backend a session; and whether orchestrating any of this with LangGraph measurably beats the same SQL run as a plain deterministic script — including what to conclude if it does not. Those are separate reader jobs, they need their own tests and raw measurements, and none of them should ship as a claim before the lab produces the artifacts.